Bode and Nyquist diagrams using GNU Octave
Using GNU Octave is easy to plot Bode and Nyquist diagrams, as follows:
bode(zp([], [-1*i, i, -1], 1))
nyquist(zp([-0.5], [0.0, -0.2, -4], 1))
Using GNU Octave is easy to plot Bode and Nyquist diagrams, as follows:
bode(zp([], [-1*i, i, -1], 1))
nyquist(zp([-0.5], [0.0, -0.2, -4], 1))
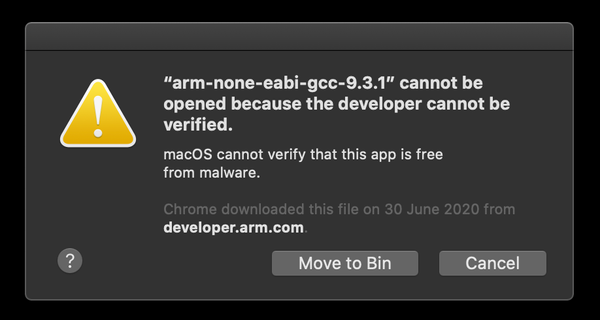
Lately I was installing the embedded ARM toolchain to compile some STM32 code, and I ran into this beautiful error: If you are a macOS user it's very probable that you have already seen this message, and most likely you already know the workaround (which is right-click on
The Olimex USB-serial-cable - a 3.3v USB-to-serial adapter based on the PL2303XA chip - won't work out of the box on macOS. While there are various drivers out there in the wild, my experience with these was far from optimal. Then, I finally I found my peace

Some time ago I wrote a post on how to brew and manage multiple (Adopt)OpenJDK versions on your mac - which is my current java setup. Premised so, lately I wanted to install STM32CubeMX on my (freshly formatted) laptop and I incurred in this friendly error: Andreas-MacBook-Pro:~ a.leofreddi$

AWS Cognito is a great tool to chop-off authentication from your app, with a lot of bonuses when it comes to single sign on and integration with existing directories, but the web console is lacking some basic user management functionalities. Things like deleting a user by username or send back